Visualization of Aligned Data
learning-objectives
- Know the value and limitations of visualizing RNA-Seq data
- Know what files are needed to visualize RNA-Seq data
- Know how to visualize RNA-Seq data in a genome browser
Visualization of RNA-Seq Data
In our final section, we will do a visualization of RNA-Seq data. First however, we should look inside an example output from Kallisto. This is the a few rows of an abundances.tsv file generated by Kallisto.
target_id               length  eff_length      est_counts      tpm
ENSMUST00000200975.1    549     350             1.18344         0.0940757
ENSMUST00000227926.1    1208    1009            0               0
ENSMUST00000230908.1    408     209             53.8003         7.16208
ENSMUST00000229487.1    97      4.17138         0               0
ENSMUST00000202689.1    545     346             0               0
ENSMUST00000201265.1    389     190             0               0
ENSMUST00000201986.1    639     440             0               0
ENSMUST00000181583.4    387     188             0               0
ENSMUST00000181459.3    451     252             0               0
ENSMUST00000236254.1    489     290             0               0
There is some important information - the target_id row shows the name of the mouse transcript (from the reference transcriptome). The est_counts row shows approximately how many reads matched that transcript. The tpm or transcripts per million is a normalized value for the read count (longer genes will have more reads because they are longer, not necessarily because they are expressed more highly). But where are these reads in the genome, and are there another way to visualize them.
BAM File
Along with this list of gene expression value, we also get a type of file called a BAM. BAM (which is the compressed format of a file type actually known as SAM) is a format for storing information about how reads have been aligned to a genome. It has coordinates for that the mapped reads, and contains information about the quality of the mapping (e.g. gives scores to indicate for example if a read map perfectly with no mismatches or if there were mismatches, how many and where). Since this file is compressed, we can not preview it, but we can load it into a genome browser.
Genome Browsers
The topic of Genome Browsers is covered extensively in the GEA Genome Browser Lesson. Briefly, a genome browser allows us to see data like sequencing reads aligned against a genome of interest.
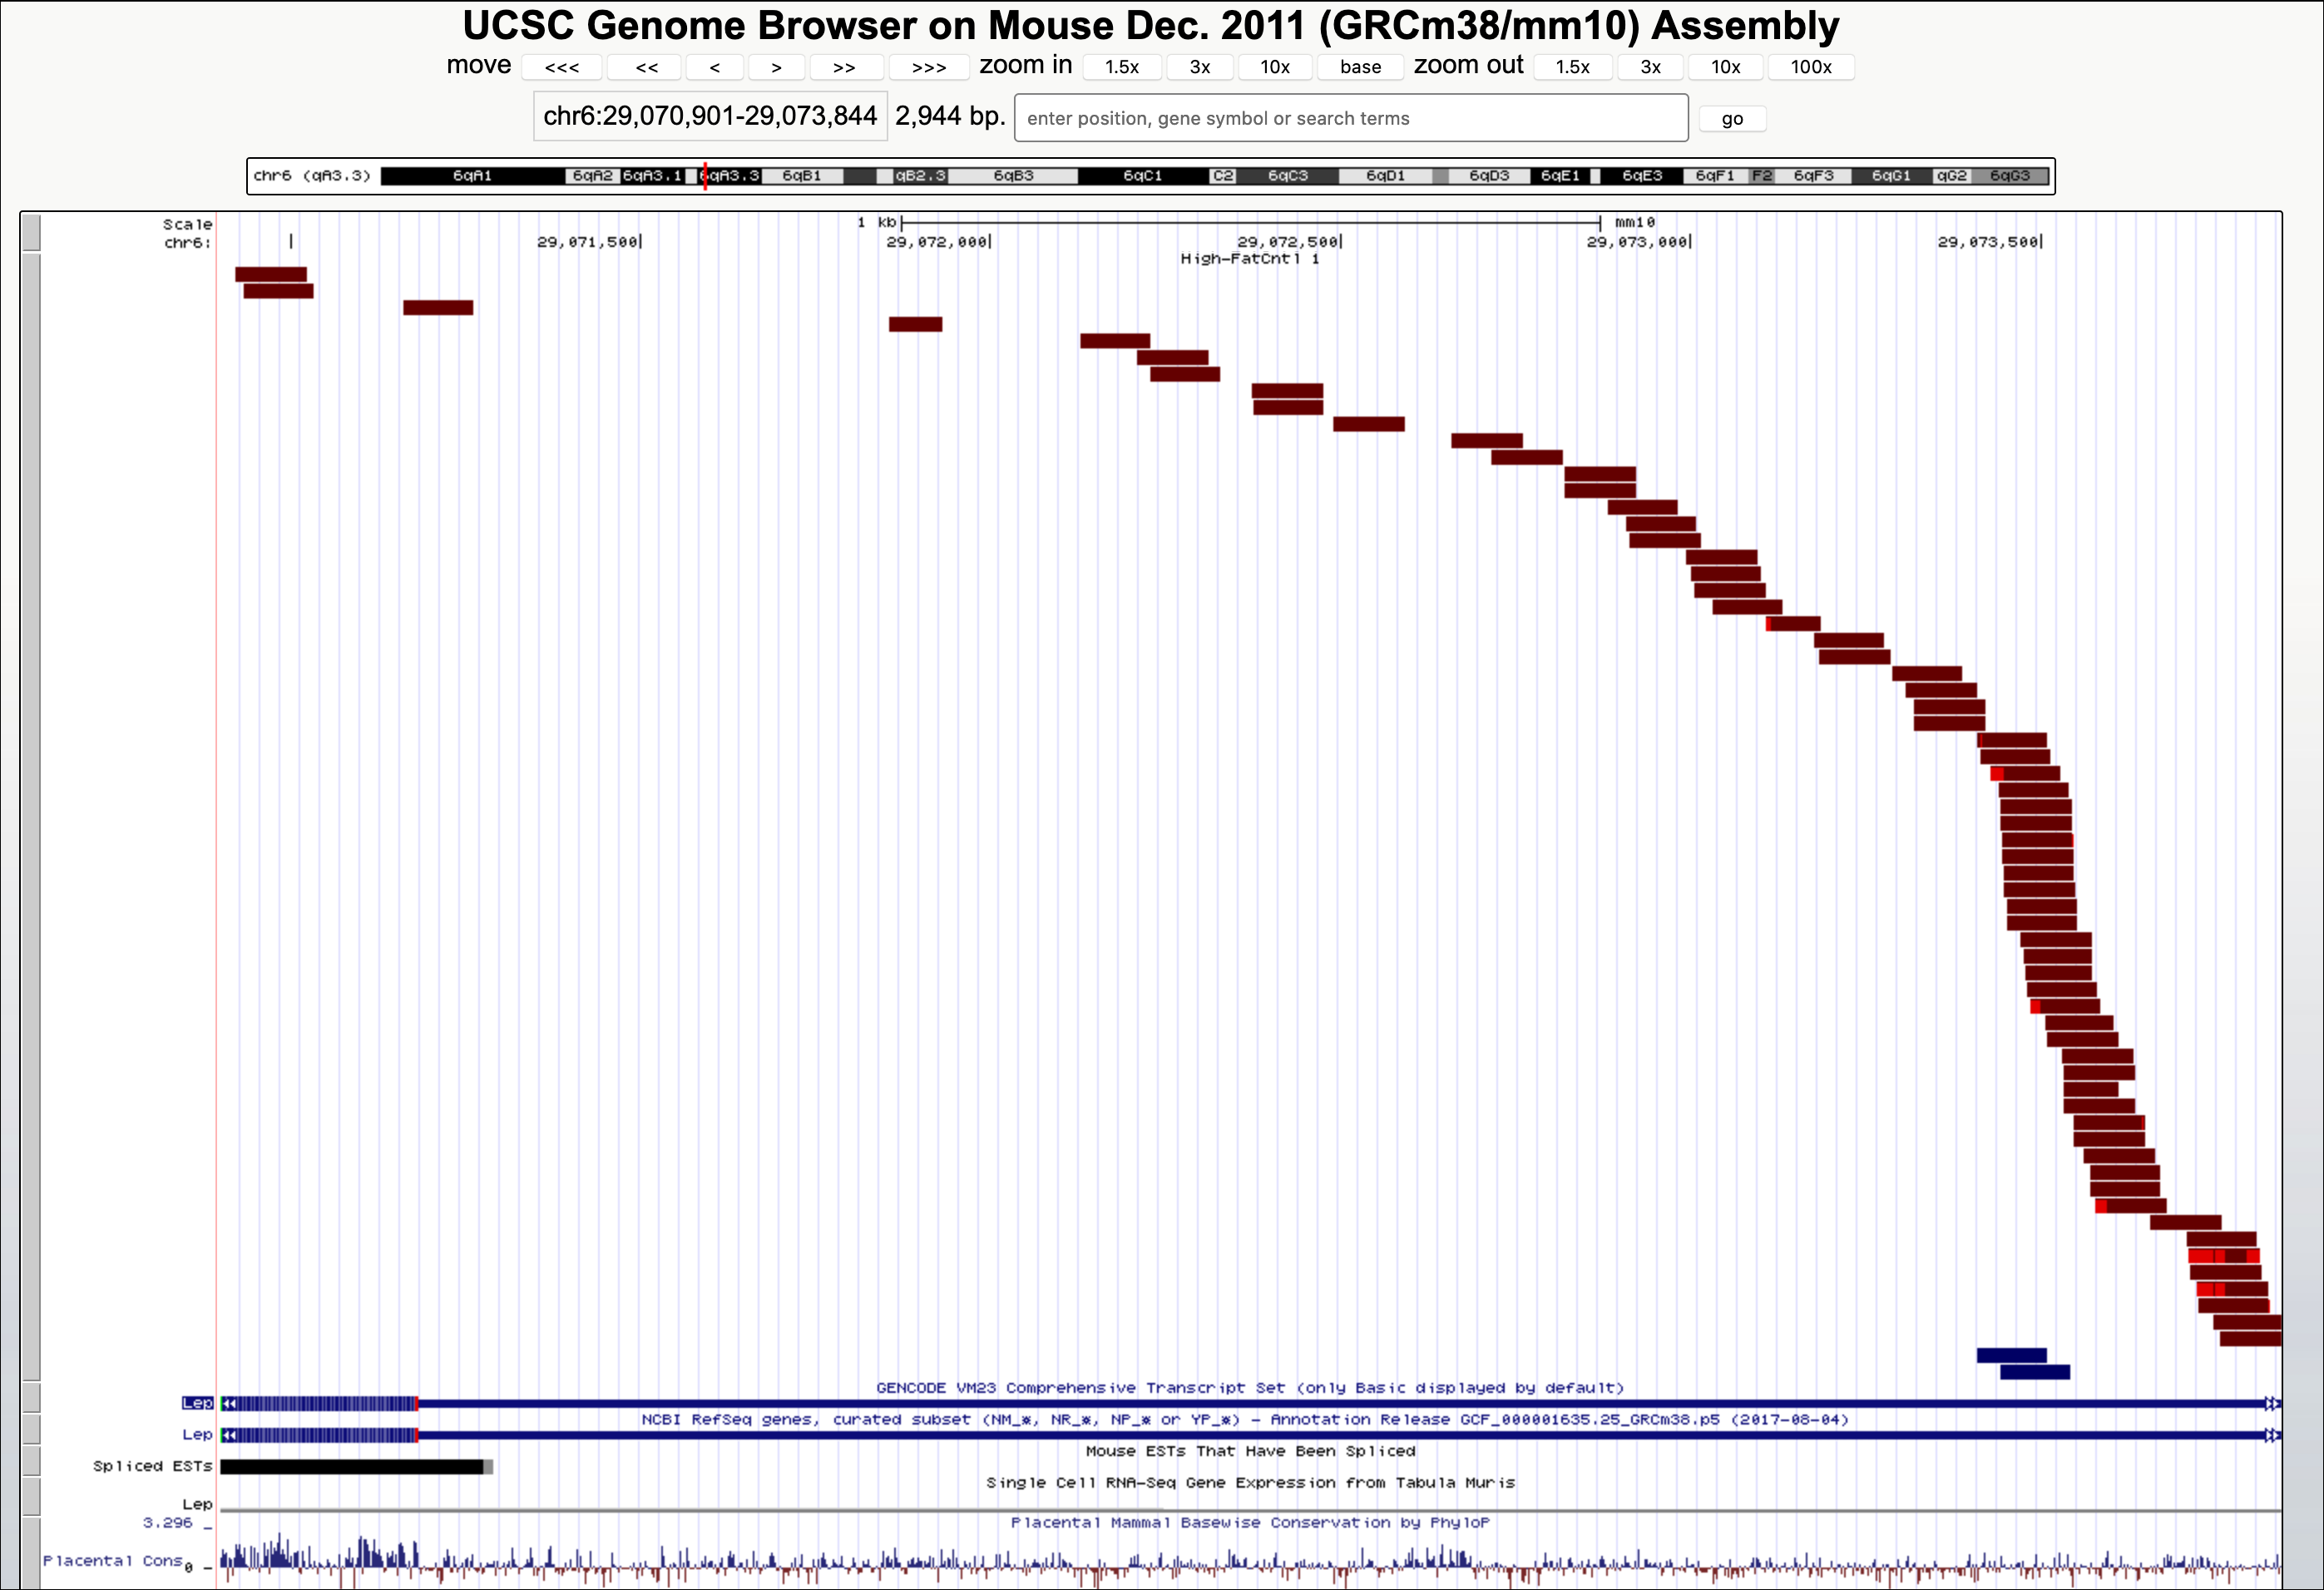
In the view below, each brown rectangle represents an RNA-Seq read that has been mapped to a location (in this case the Leptin gene) on the genome.
Limitations of visualization
As you will do in the exercise, it is possible to visualize several BAM files at once, and therefore compare visually the number of reads mapped in each of the RNA-Seq samples (i.e. from control and tumor samples). This visual information is useful, and sometimes by eye you can see obvious differences. However, a visual estimate is not a substitute for an actual statistical analysis. This type of analysis is beyond the scope of this lesson, but all the work done so far could be taken to the next step (e.g. analysis with the Sleuth package) to do an analysis and generate statistics which could support a conclusion that the tumor and control tissues are the same or different in their levels of gene expression.
Visualization tools
In the exercises you will be able to use three different methods to visualize the RNA-Seq alignments:
- genomeview a Python tool that will load the BAM files directly
- UCSC genome browser - this online browser will load BAM files from a URL*
- IGV genome browser - this online browser will load BAM files from a URL**
Note * BAM files are very large and online tools will generally not let you upload them. As a workaround, we have stored the BAM files from this lesson’s analysis on the CyVerse Data Store. The Data Store generates a URL that allows genome browsers to pull just the requested portions of data to generate a visualization.
Note ** IGV is a standalone program and you must install it on your local computer to use it.
Use Genome Browsers to Visualize RNA-Seq Reads
Using the Jupyter Notebook, you will run visualize aligned RNA-Seq reads using GenomeView and the UCSC genome browser. With optional IGV download, you can further extend the visualization.
1. Access the JupyterLab Lesson on CyVerse and complete Notebook 4: Visualize BAM file alignment at the Leptin gene locus
Notebook Preview
This is a preview of the notebook in this lesson. Go back to JupyterLab Lesson on CyVerse to launch and use the interactive notebook.
Questions
Question
- What is the benefit of visualizing RNA-Seq data?
- What file is used to visualize RNA-Seq data, and what kind of information is included in this file?
- Can visualization alone tell you what you need to know about gene expression, why or why not?