Assessing Data Quality
learning-objectives
- Know what a FastQ file is
- Know how we characterize error in DNA sequence
- Use FasQC to evaluate sequence quality
- Know how to interpret a FastQC report
Note
Materials in this section draw on lessons developed as part of the Data Carpentry Genomics lesson. See those lessons for more information. Data Carpentry Lessons are Licensed under CC-BY 4.0 2018–2019 by The Carpentries.
Introduction to FastQ files
High-throughput sequencing is an approach to DNA sequencing that allows researchers to sequence millions of bases of DNA, usually in a matter of hours. This revolutionary technology was popularized in 2008 and is still advancing, making it possible to sequence entire genomes quickly and at low cost.
Tip
Read more about genome sequencing DNA Sequencing Fact Sheet.
When data from DNA sequencing is produced, it is stored in a file format called FastQ. This file contains information not just about the DNA sequence itself (e.g. the nucleotide sequence) but also contains information about the quality of the DNA sequence. Sequencing DNA is not an error-free process. Like any measurement, there is a potential for error. In generating millions of bases of DNA sequence, tens or or hundreds of thousands of those bases may be mistaken. Fortunately, we can estimate the error; we do this using something called a Phred score.
FastQ file format
A fastQ file (file extension .fastq) is a file that contains perhaps hundreds of thousands or millions of individual sequence reads. Each sequence read is represented in 4 lines of the file. Here is an example:
@HWI-ST330:304:H045HADXX:1:1101:1111:61397
CACTTGTAAGGGCAGGCCCCCTTCACCCTCCCGCTCCTGGGGGANNNNNNNNNNANNNCGAGGCCCTGGGGTAGAGGGNNNNNNNNNNNNNNGATCTTGG
+
@?@DDDDDDHHH?GH:?FCBGGB@C?DBEGIIIIAEF;FCGGI#########################################################
Each of the lines has some information:
Line Description 1 Always begins with ‘@’ and then information about the read (e.g. it’s direction, the machine it was sequenced on, etc.) 2 The actual DNA sequence 3 Always begins with a ‘+’ and sometimes the same info in line 1 4 Has a string of characters which represent the quality scores; must have same number of characters as line 2
As mentioned above, line 4 is a encoding of the quality. In this case, the code is the ASCII character table. According to the chart a ‘#’ has the value 35 and ‘!’ has the value 33 - But these values are not actually the quality scores! There are actually several historical differences in how Illumina and other players have encoded the scores. Here how the characters on line 4 decode into values for the Phred score.
 SSSSSSSSSSSSSSSSSSSSSSSSSSSSSSSSSSSSSSSSS.....................................................
 ..........................XXXXXXXXXXXXXXXXXXXXXXXXXXXXXXXXXXXXXXXXXXXXXX......................
 ...............................IIIIIIIIIIIIIIIIIIIIIIIIIIIIIIIIIIIIIIIII......................
 .................................JJJJJJJJJJJJJJJJJJJJJJJJJJJJJJJJJJJJJJJ......................
 LLLLLLLLLLLLLLLLLLLLLLLLLLLLLLLLLLLLLLLLLL....................................................
 !"#$%&'()*+,-./0123456789:;<=>?@ABCDEFGHIJKLMNOPQRSTUVWXYZ[\]^_`abcdefghijklmnopqrstuvwxyz{|}~
 |                         |    |        |                              |                     |
33                        59   64       73                            104                   126
 0........................26...31.......40
                          -5....0........9.............................40
                                0........9.............................40
                                   3.....9.............................40
 0.2......................26...31........41

S - Sanger        Phred+33,  raw reads typically (0, 40)
X - Solexa        Solexa+64, raw reads typically (-5, 40)
I - Illumina 1.3+ Phred+64,  raw reads typically (0, 40)
J - Illumina 1.5+ Phred+64,  raw reads typically (3, 40)
    with 0=unused, 1=unused, 2=Read Segment Quality Control Indicator (bold)
    (Note: See discussion above).
L - Illumina 1.8+ Phred+33,  raw reads typically (0, 41)
The decoding has changed over time, but what you will see most frequently today is Illumina 1.8. So the value “!” at line 4 of a read is equal to a Phred score of 0 and an “I” has a Phred score of 41.
Phred score in detail
A Phred score is a measure of uncertainty and error. The value of a Phred score is an indication of how likely it is that a base reported in a sequencing read is in error. Here is the table describing the Phred score values:
Phred Quality Score Probability of incorrect base call Base call accuracy 10 1 in 10 90% 20 1 in 100 99% 30 1 in 1000 99.9% 40 1 in 10,000 99.99% 50 1 in 100,000 99.999% 60 1 in 1,000,000 99.9999%
Running and interpreting FastQC
FastQC is one of several programs we can use to determine the quality of DNA sequence. A single fastQ file may have millions of individual sequencing reads, each with its own quality information (Phred core). The FastQC report generates graphs and descriptive statistics that allow us to get a sense of the overall quality of a file of sequencing data. Once we have that information, we can use it later on to trim and/or filter out low quality data.
Tip
You should keep in mind that simply because individual reports may generate a warning or fail, this does not mean your data are unusable. In most cases poor quality reads can be eliminated by subsequent cleaning steps without losing a large amount of sequence. Some reports such as ‘Sequence Duplication Levels’ might generate a warning when analyzing RNA-Seq data where you have many highly expressed transcripts.
FastQC Report
The FastQC website gives details on all of the FastQC reports generated by the software. Here are some tips for interpreting the most important reports:
Per base sequence quality
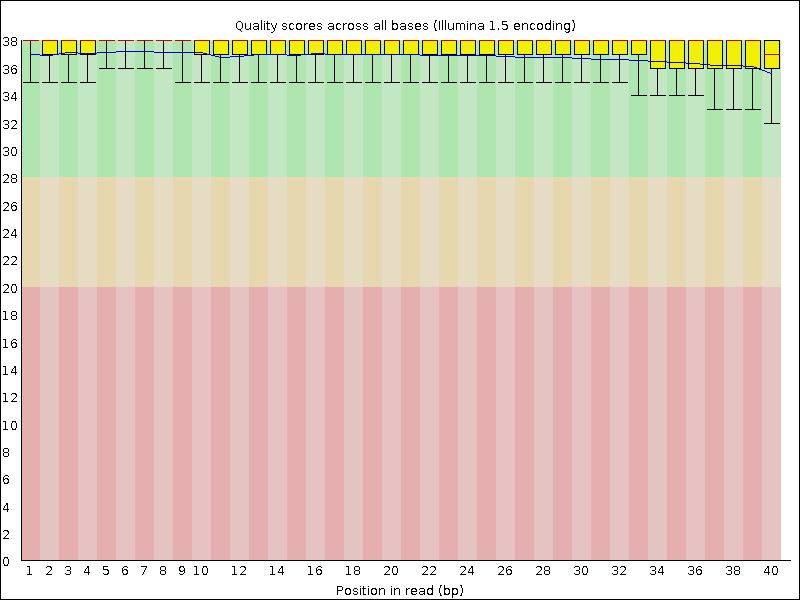
This report shows the average quality score across the length of all reads. Poor quality at the beginning or end of the reads may suggest settings for trimming.
Per sequence quality scores
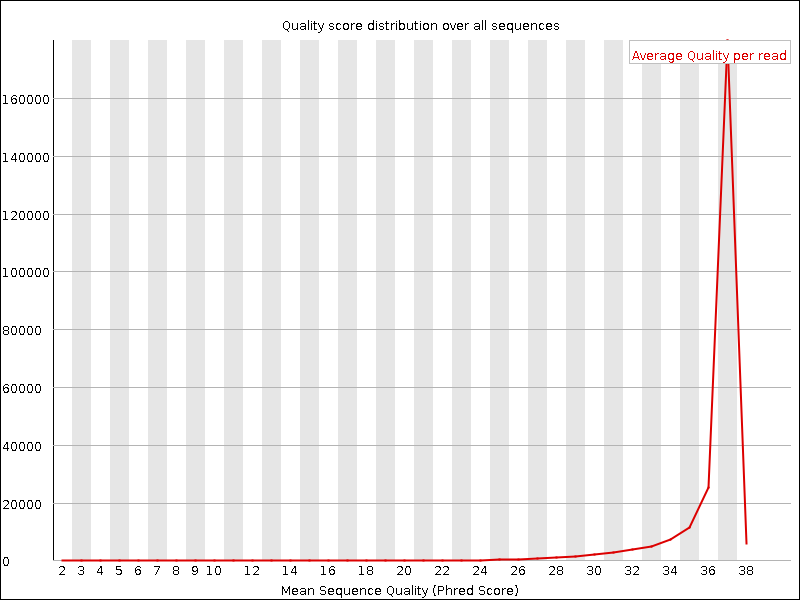
This report indicates how individual reads of a given quality score are distributed in your sequence file. Ideally, most reads will have a high average quality score. Populations of lower average-scored reads can be removed by downstream filtering.
Adapter Content
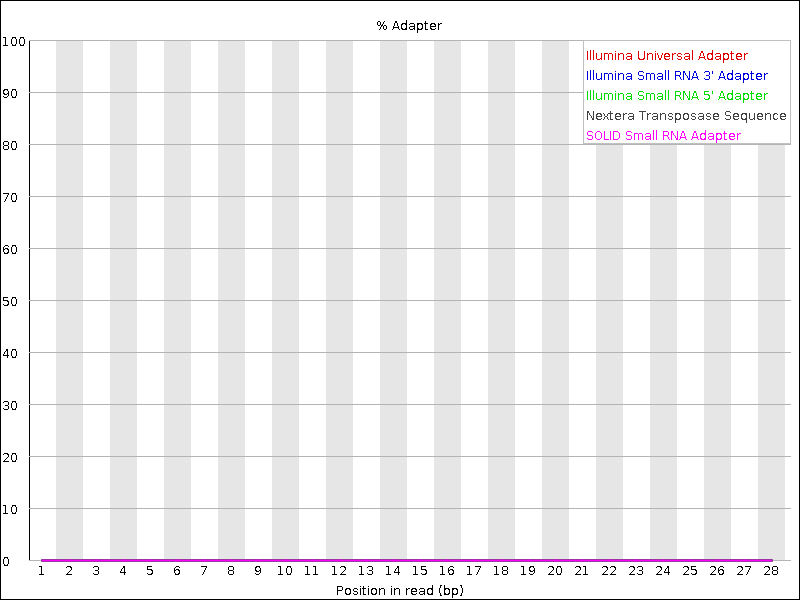
This report indicates the presence of sequencing adapters. If adapters are detected, you will need to remove them in downstream cleaning.
Running FastQC
Using the Jupyter Notebook, you will run FastQC, first to see the quality of the initial data, and later in the next notebook to see changes after trimming and filtering. Remember to check the FastQC website for additional details on the FastQC report.
Access the JupyterLab Lesson on CyVerse and complete Notebook 1: Running FastQC
Notebook Preview
This is a preview of the notebook in this lesson. Go back to JupyterLab Lesson on CyVerse to launch and use the interactive notebook.
Questions
Question
- What is a FastQ file?
- How does a FastQ file encode/represent the quality of an individual base call?
- What is a Phred score?
- How does FastQC report on the average quality of base calls at a given position along the reads in a FastQ file?
Bonus
The human genome, is more than 3 billion bases long. The human leptin gene is about 16,352 nucleotides long. If you sequenced the leptin gene and your average Phred score for that sequence was 20, about how many sequencing errors would you expect to find? What about at a Phred score of 30?